New analytics in Pobo: Compare results before and after label deployment
19.08.2026
« Back to articlesNew analytics in Pobo: Compare results before and after adding a description
How did your traffic or the number of add-to-cart actions change after you added a Pobo description to a product? New product analytics will show you the development before and after adding the description and also reveal how visitors actually interact with the content.
Where can you find product analytics?
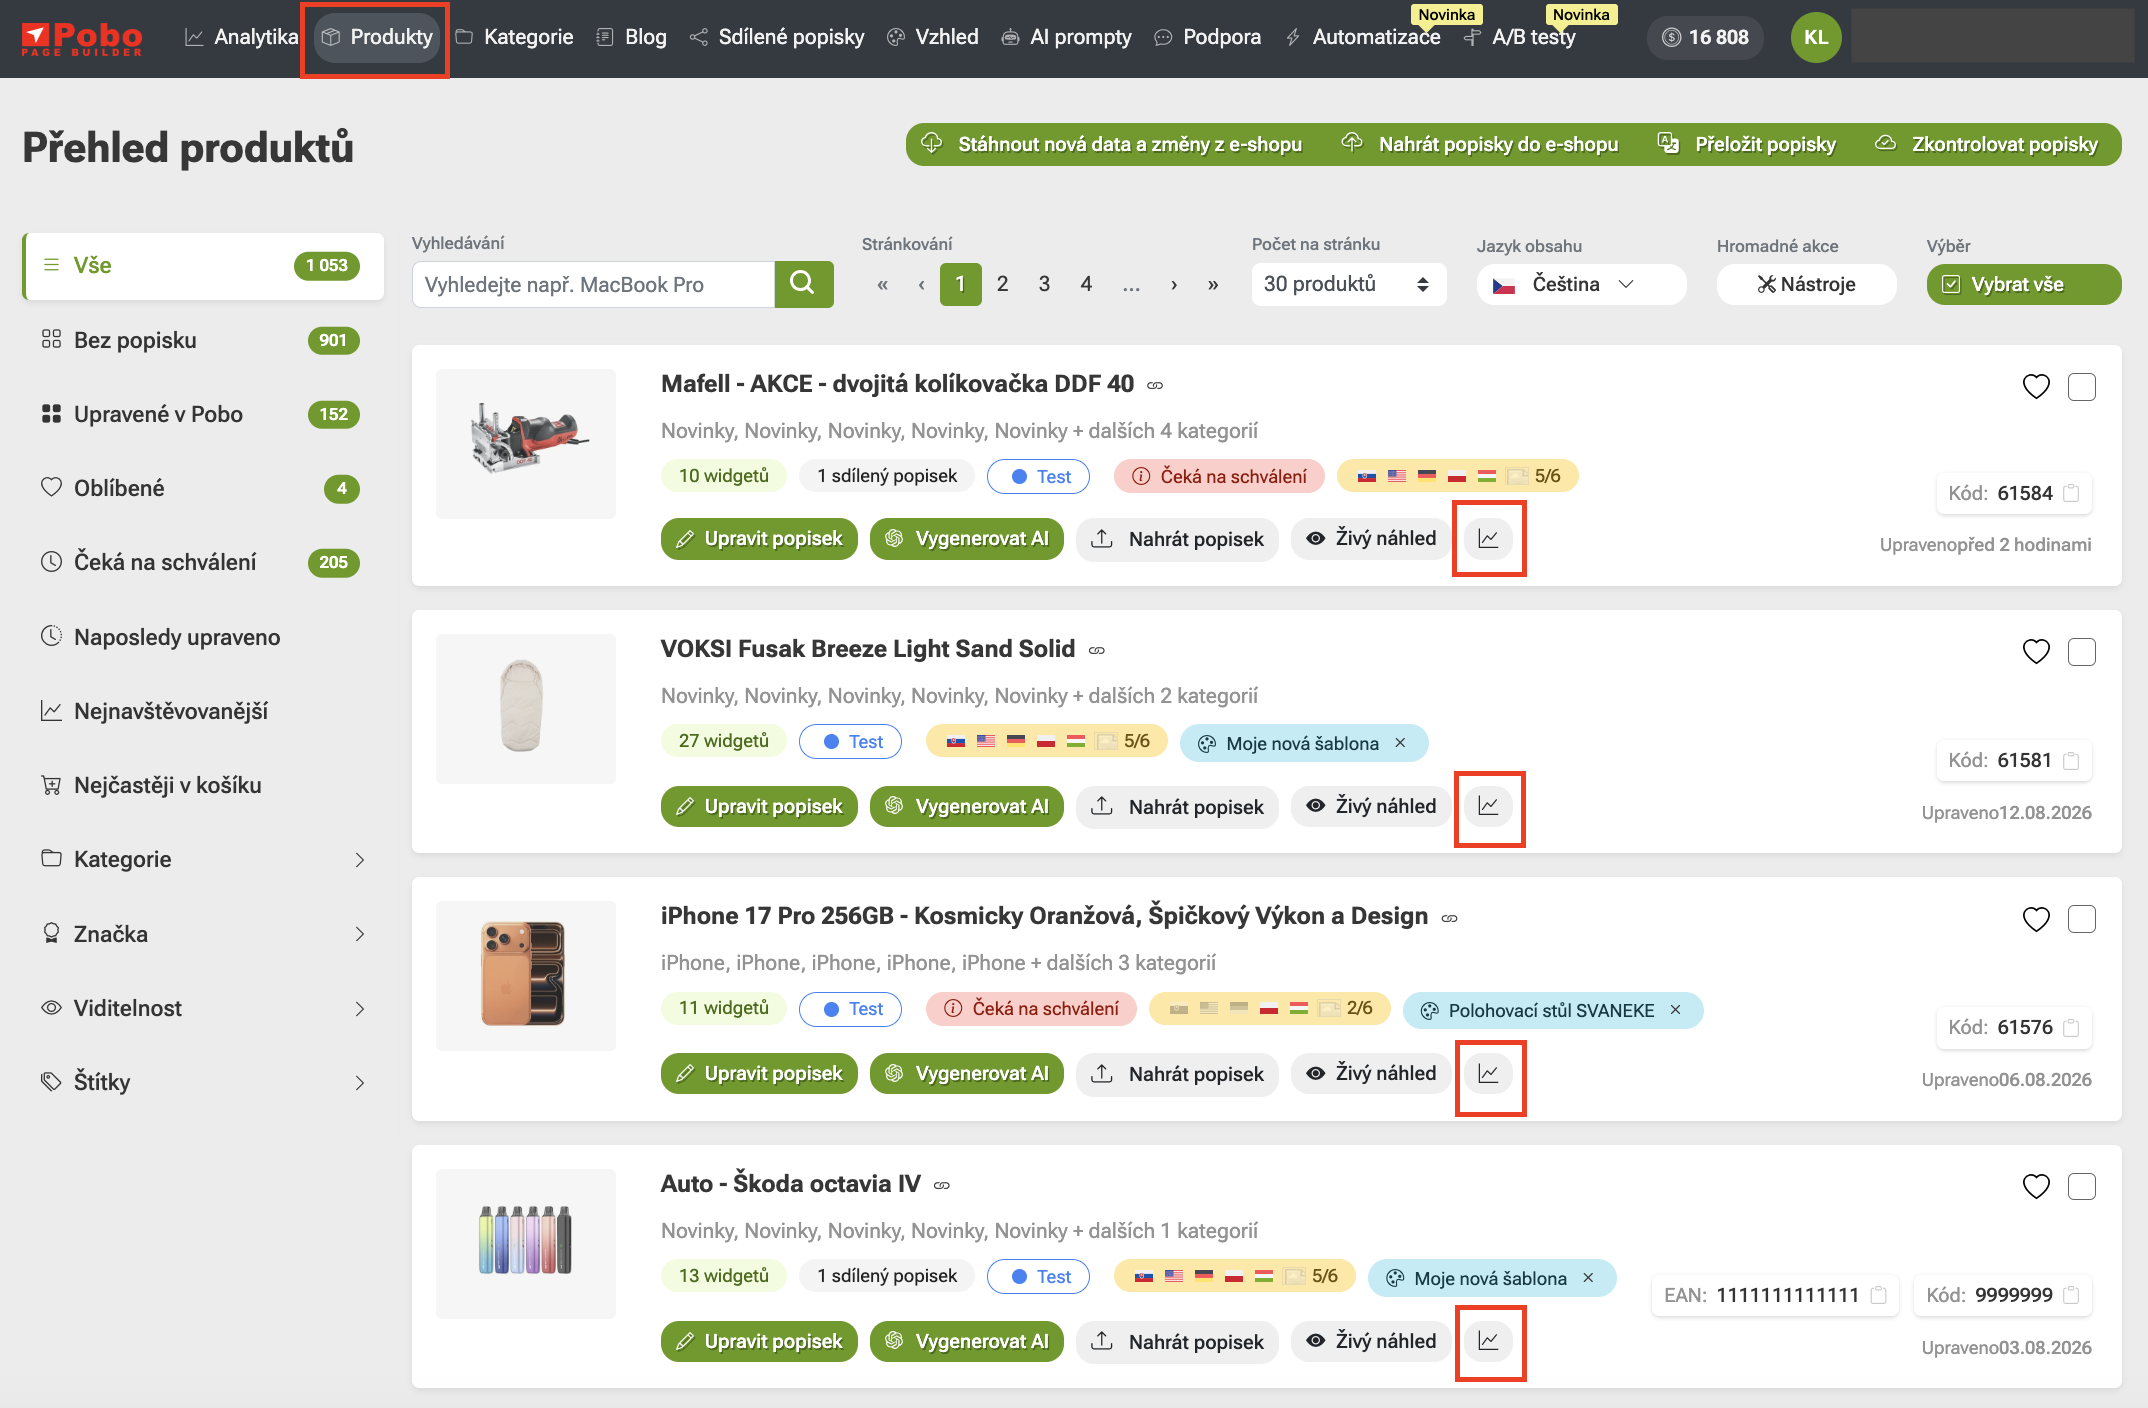
You can open analytics directly in the product overview by clicking the chart icon next to the live preview. This way, you have each product’s results all in one place.
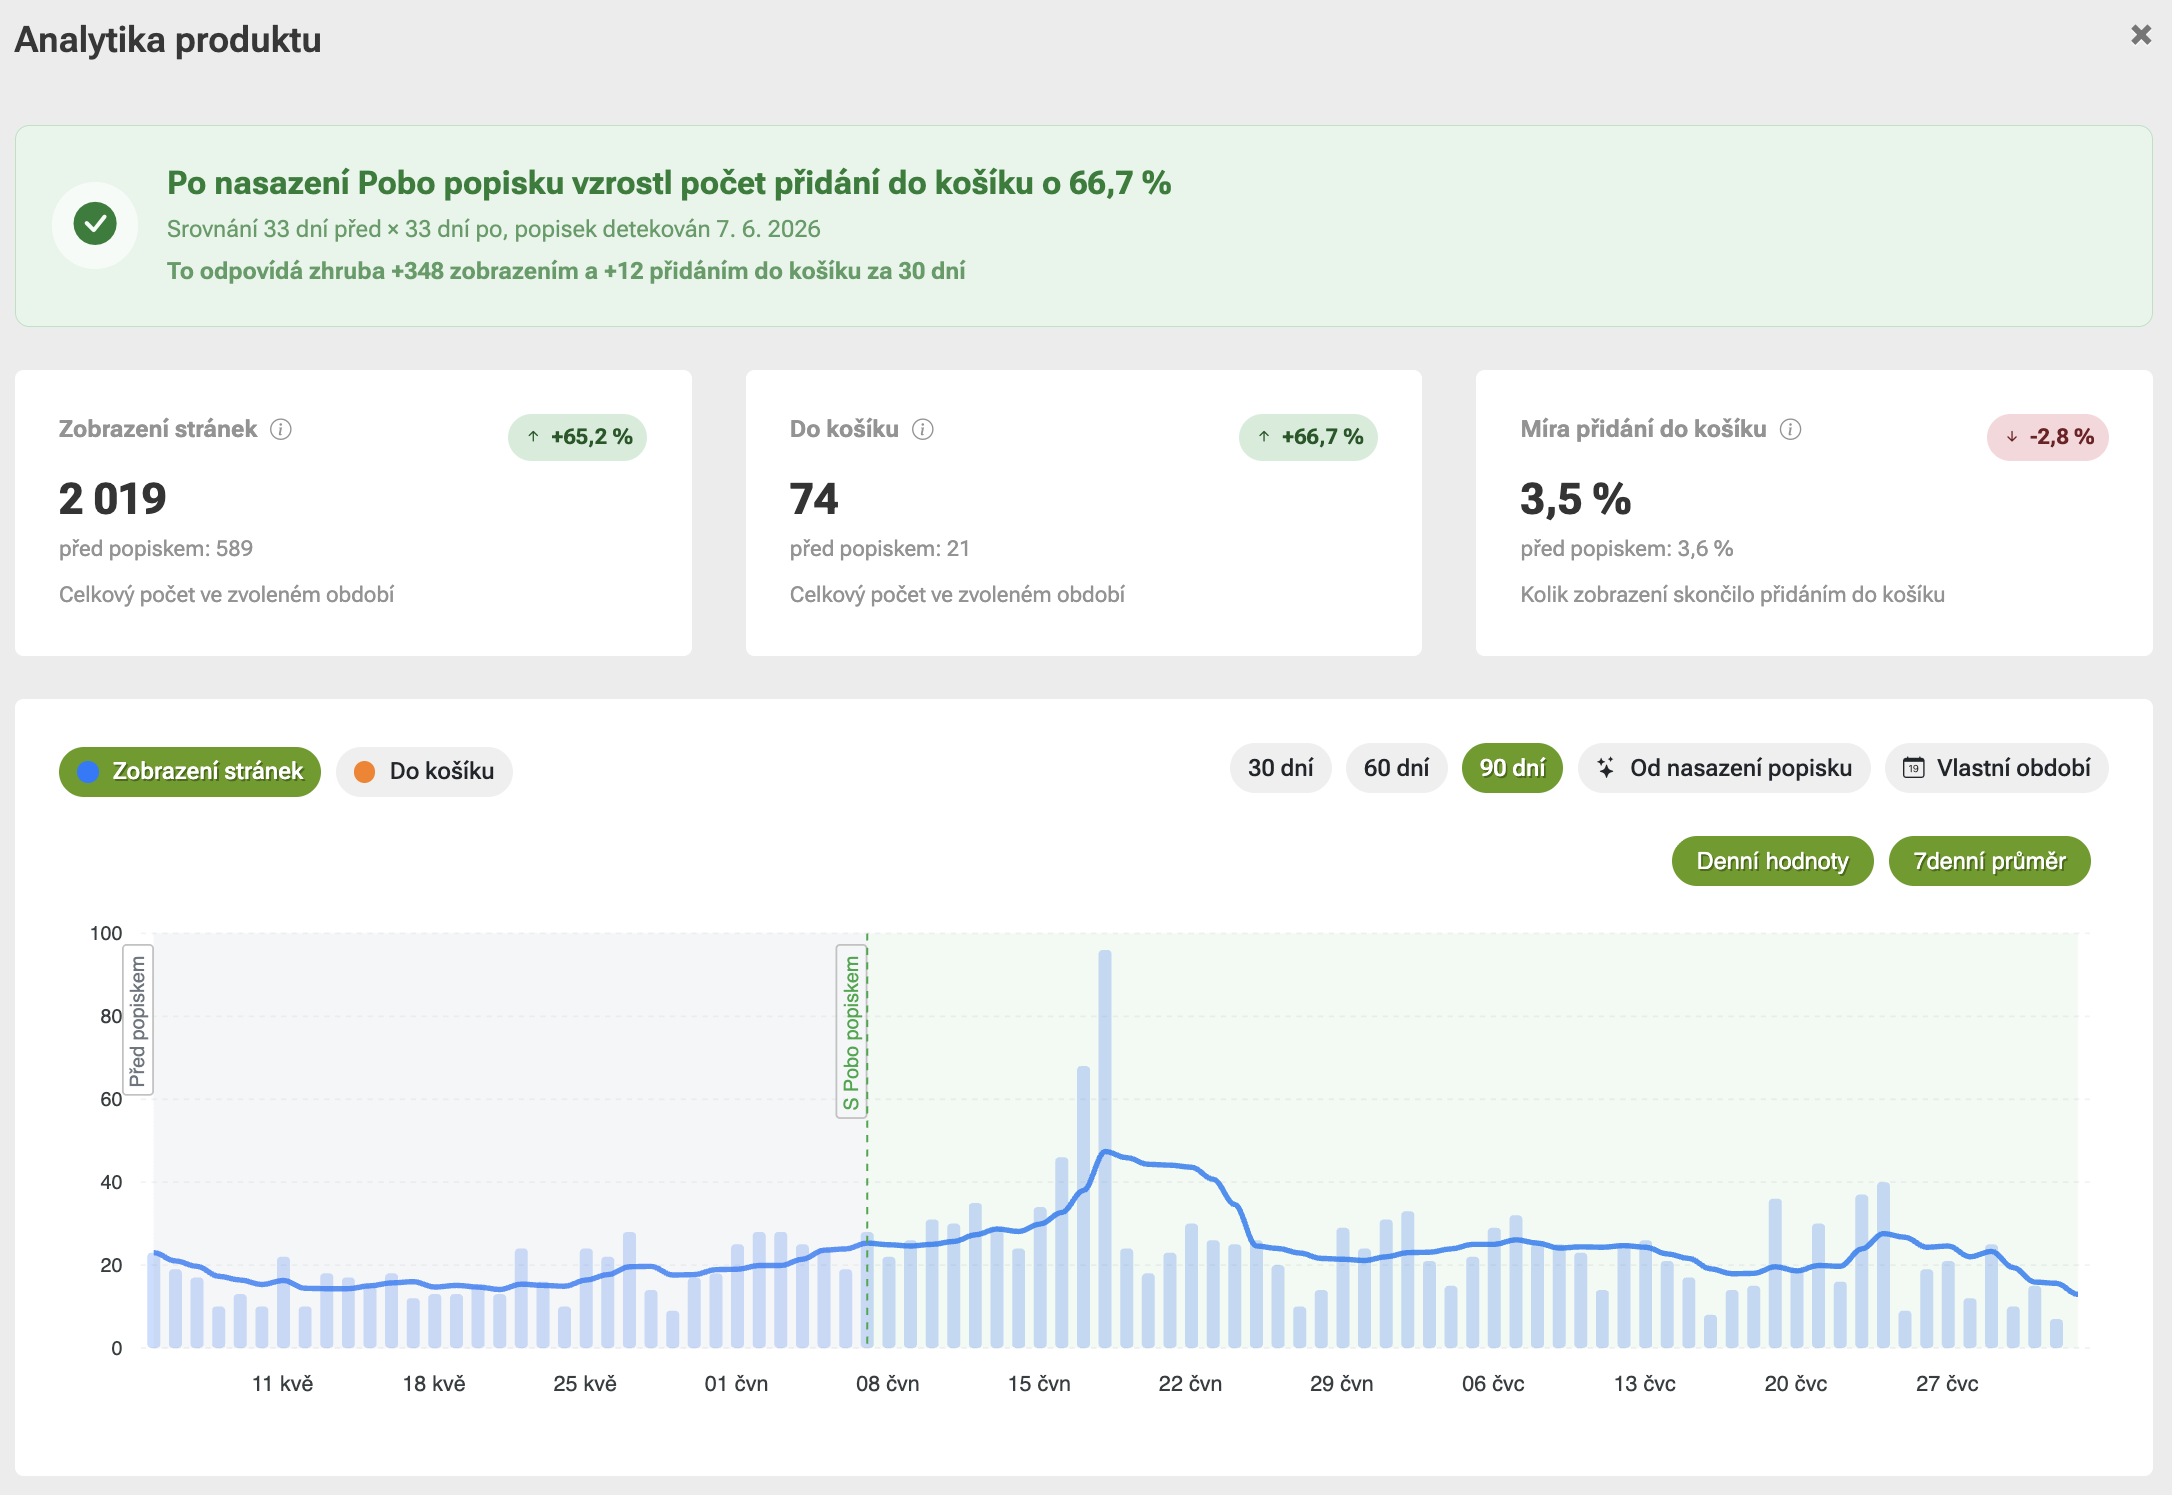
Compare the periods before and after adding the description
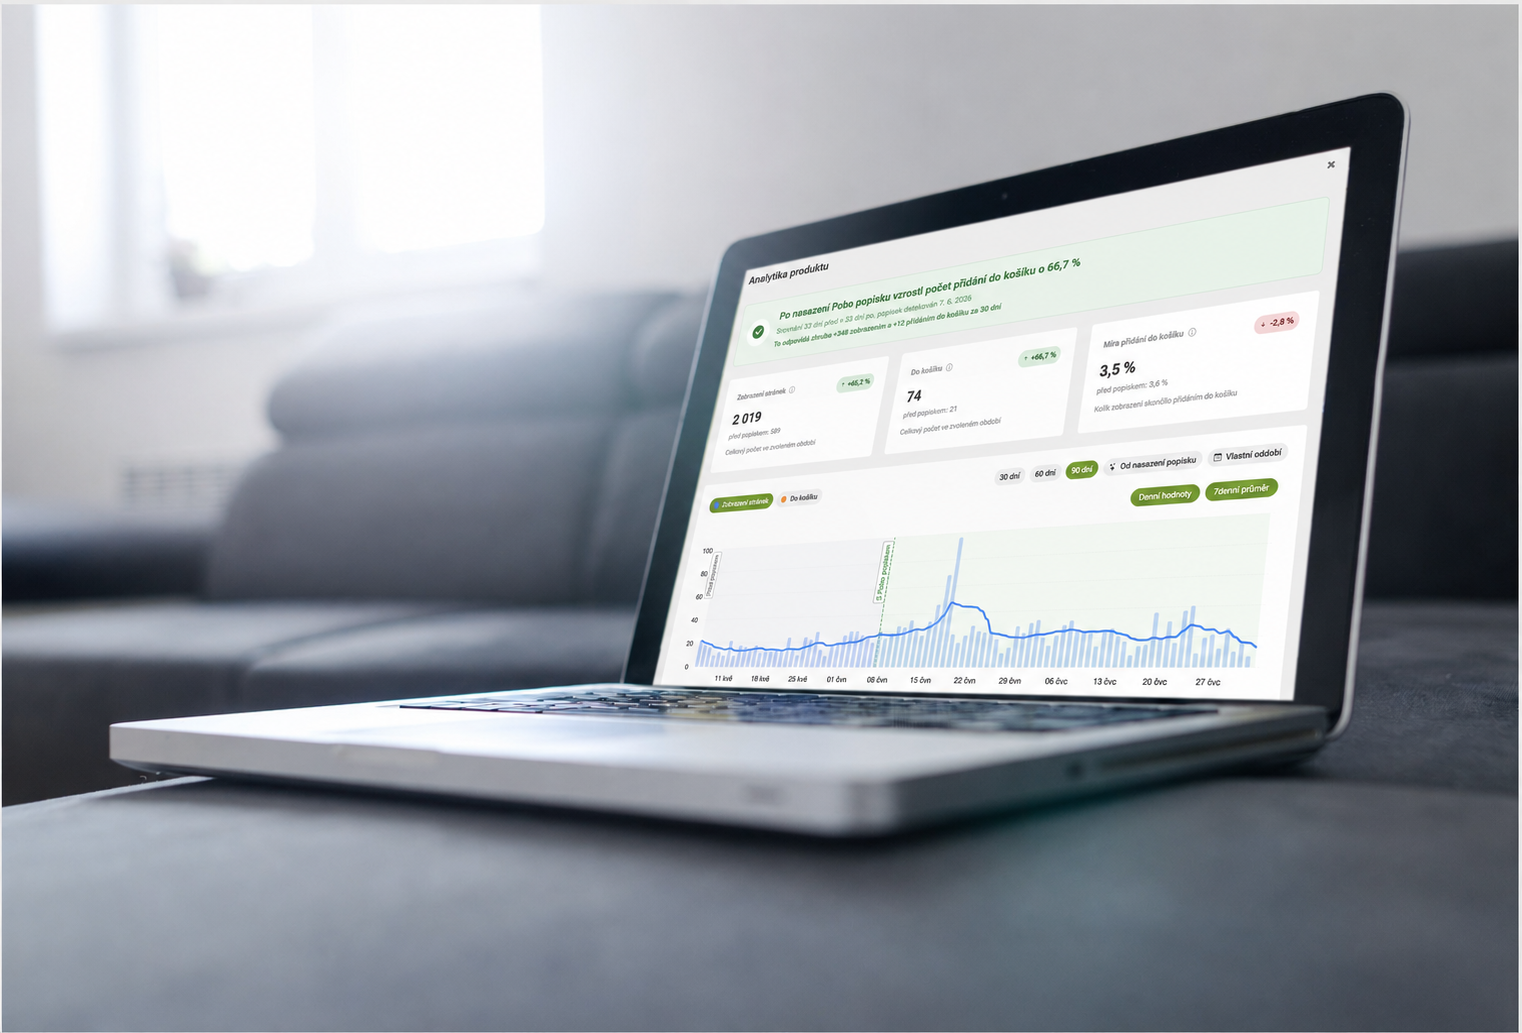
Pobo automatically detects the day when the Pobo description first appeared on the page and clearly divides the chart into the periods before and after it was added. At the top, you will immediately see the main result, such as how much the average number of add-to-cart actions per day changed after it was added.
To make the comparison fair, Pobo always compares periods of the same length. For example, if you have 30 days of data before adding the description but only 14 days after, it will compare the last 14 days before adding it with the 14 days after.
Track views, add-to-cart actions, and orders
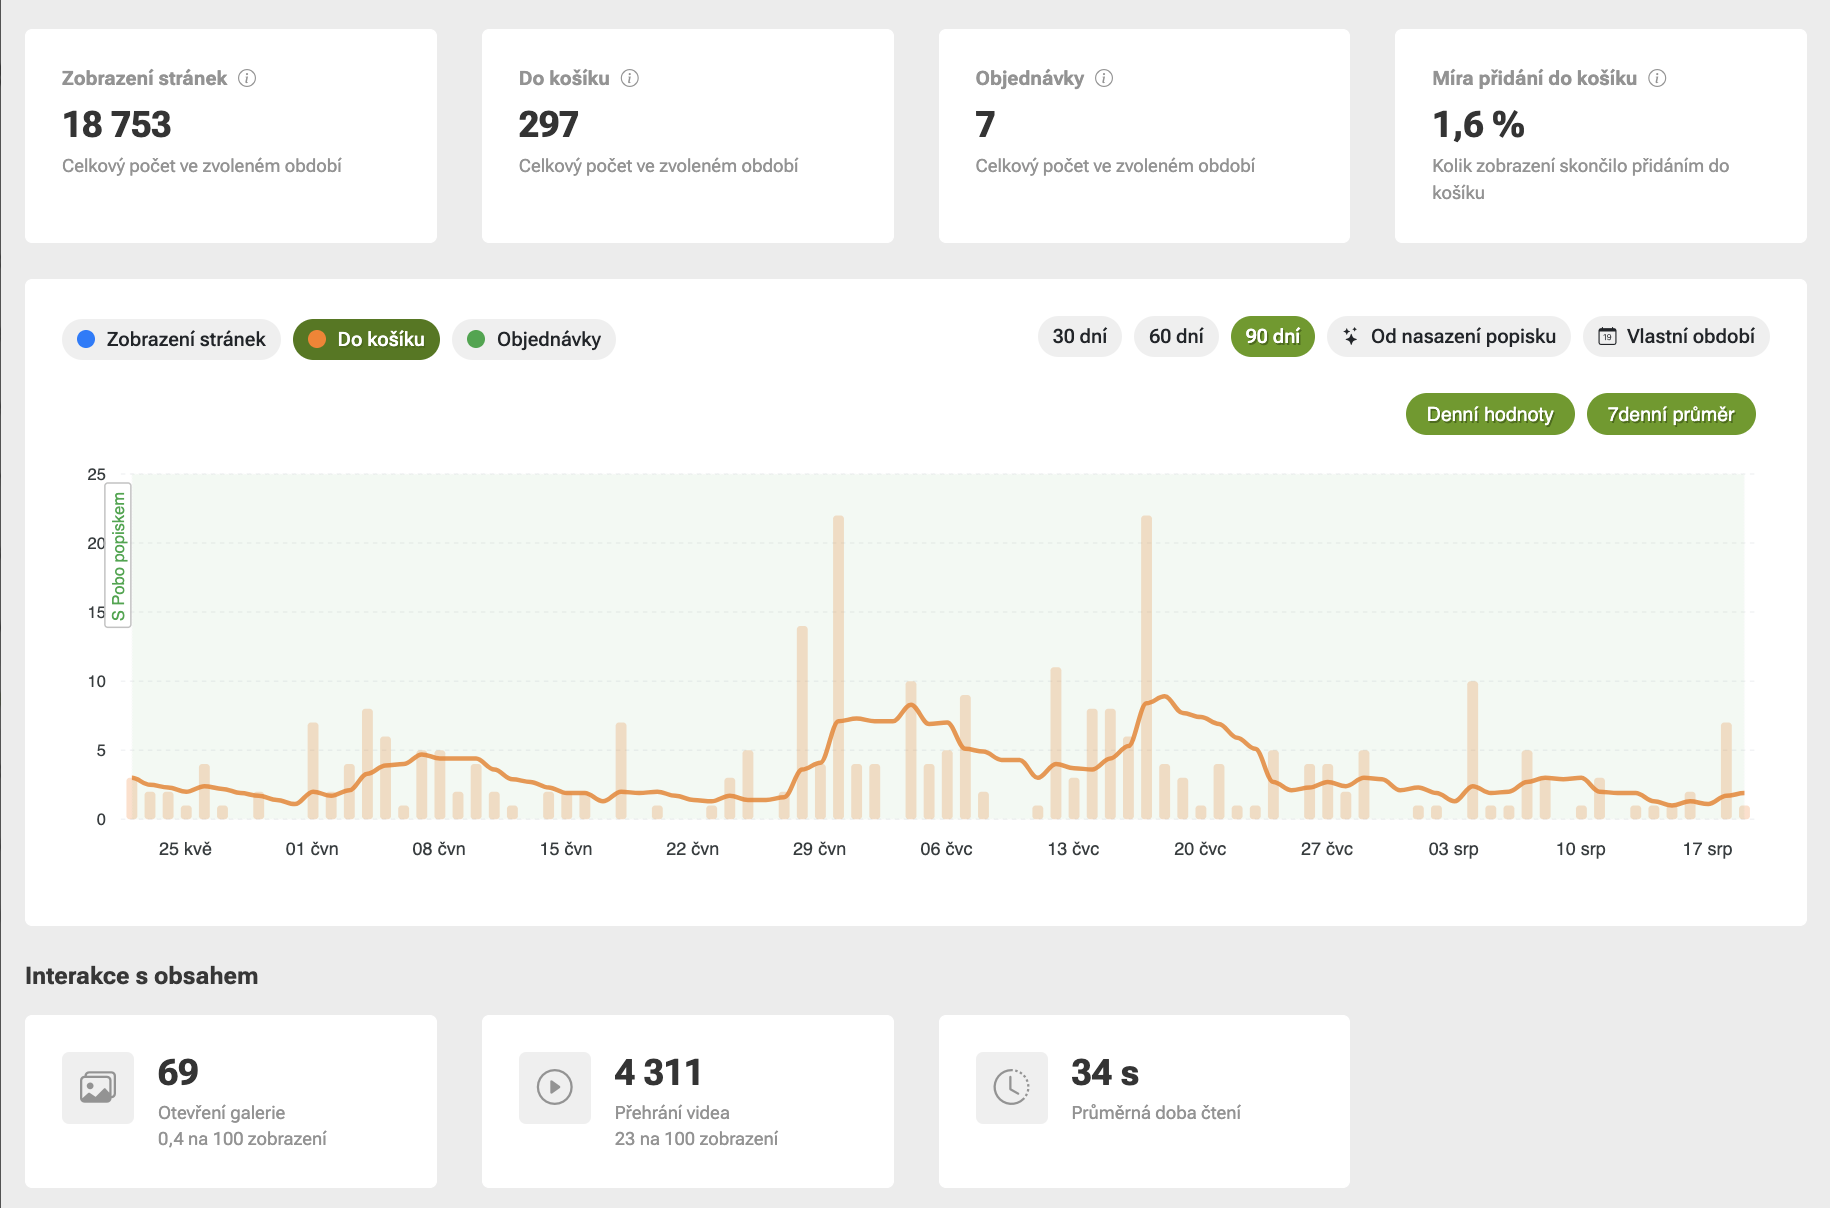
In the overview, you will see product views, the number of add-to-cart actions, and the add-to-cart rate. You can switch between individual metrics in the chart and track their daily values as well as the seven-day average. You can choose a period of 30, 60, or 90 days, the period since the description was added, or a custom range.
Supported e-shops also display orders after viewing the product. These are currently available on Shoptet. Data collection starts only when tracking is launched and is not calculated retroactively.
Find out how people interact with the description
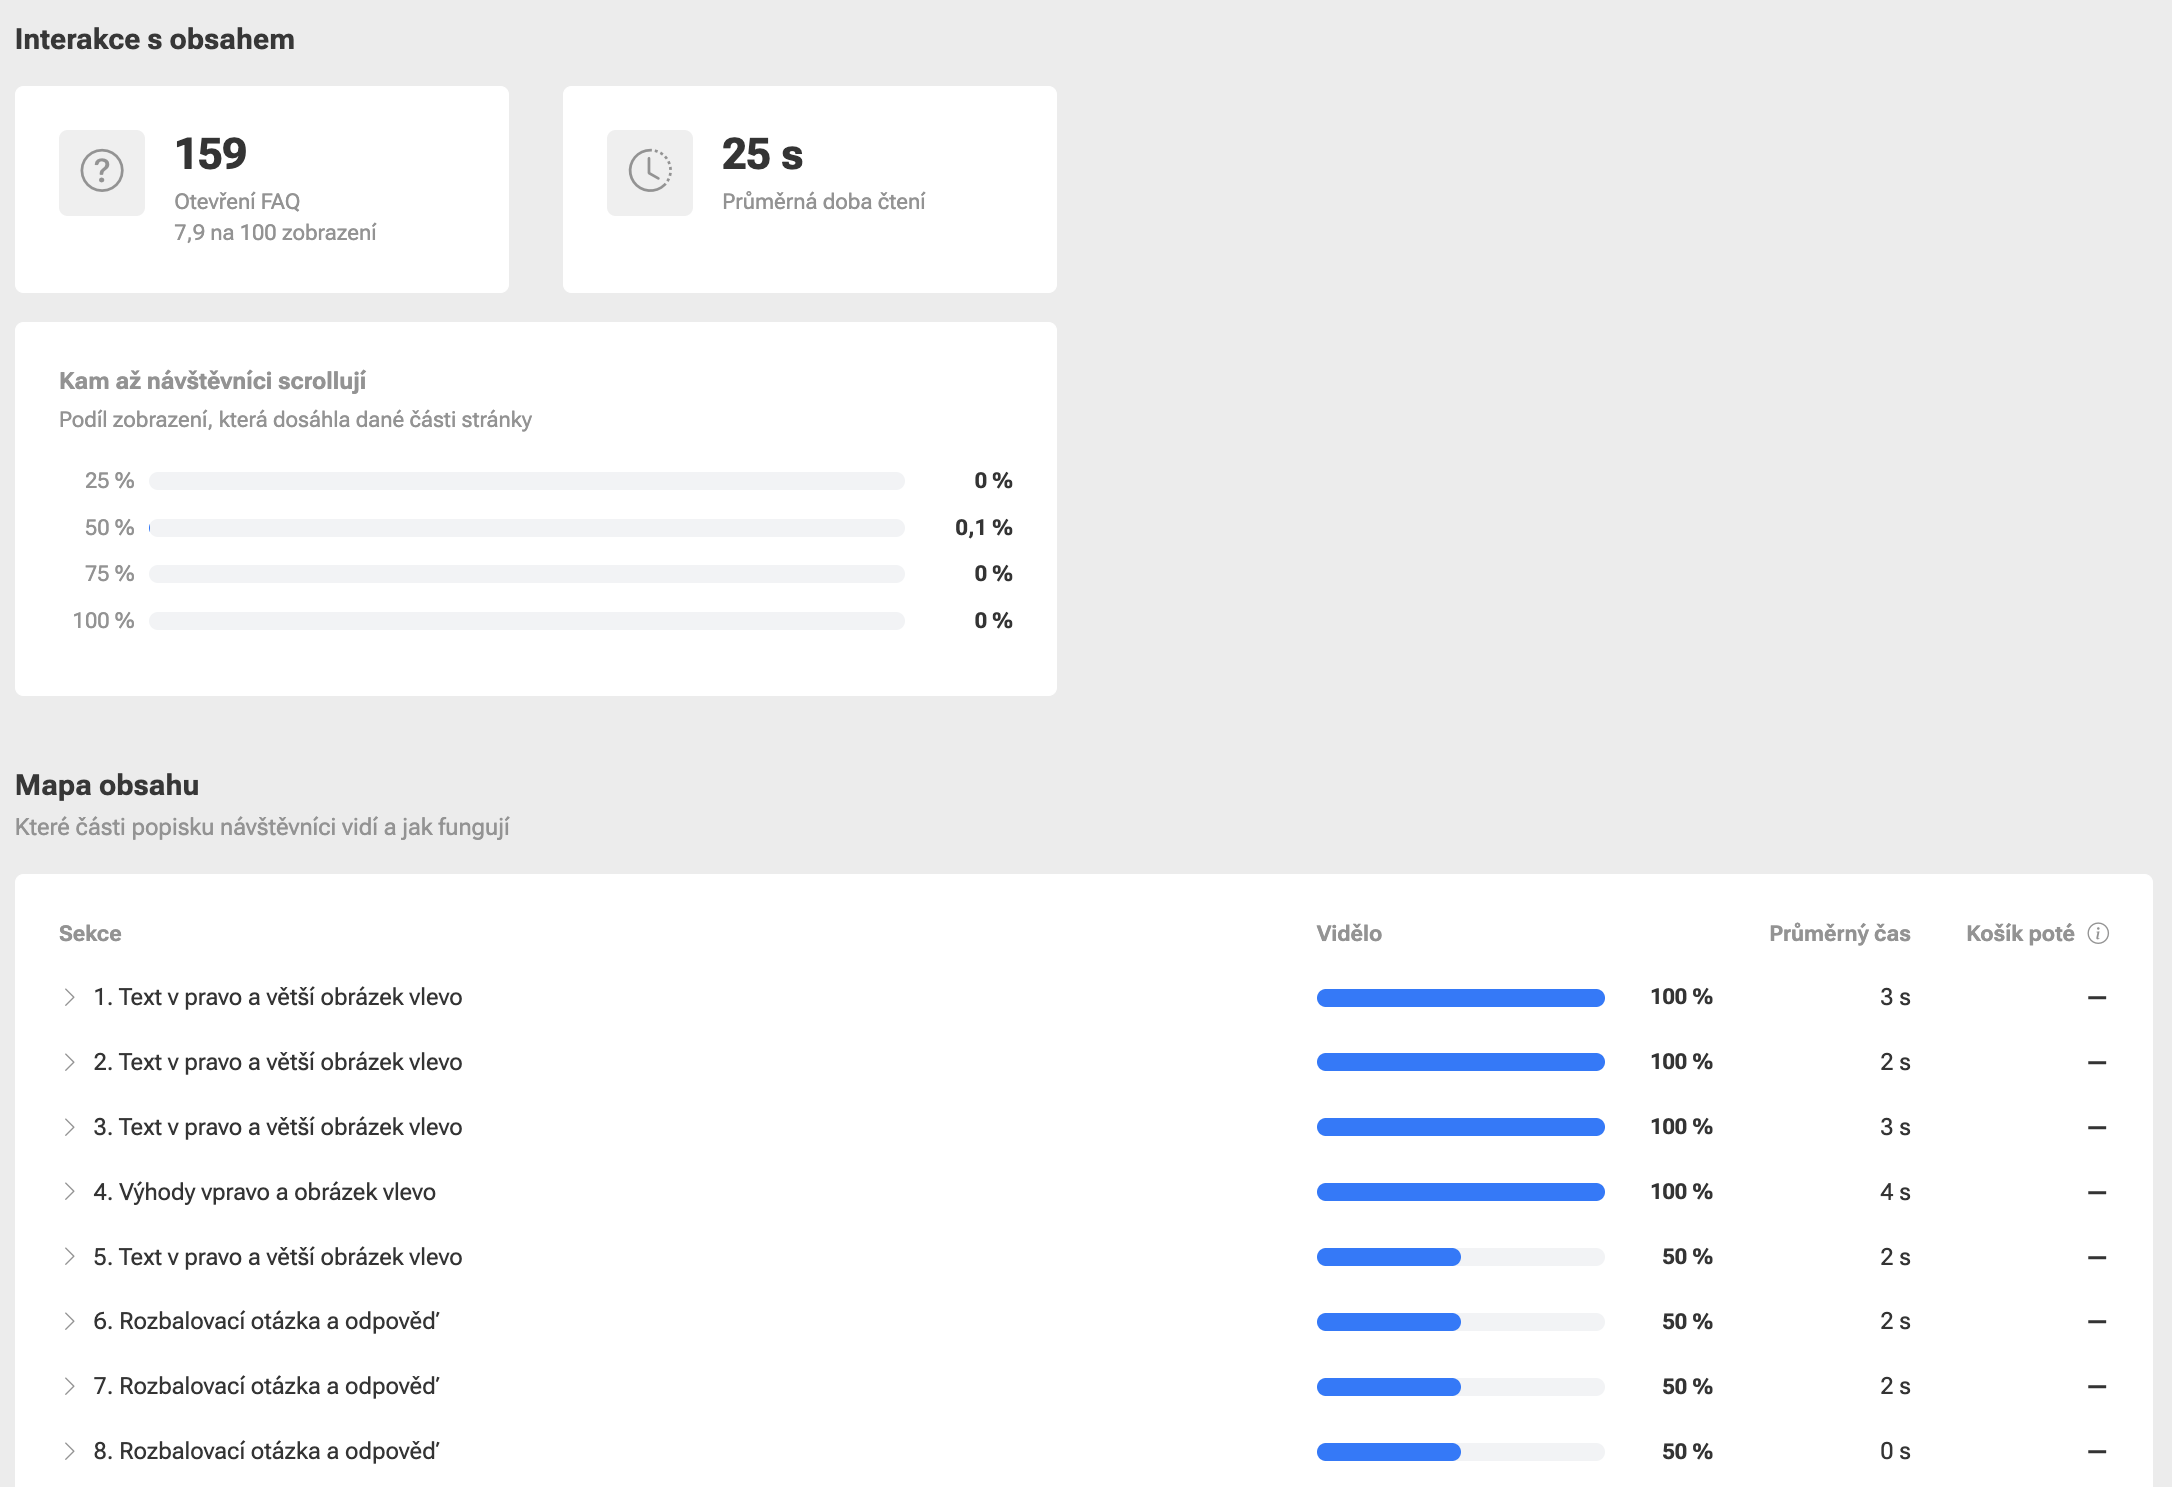
Product analytics also shows the average reading time, scroll depth, FAQ openings, gallery openings, and video plays. For FAQs, you can also find out which specific questions visitors click on most often.
In the Content Map, you will see the individual sections of the description in the order in which they appear on the page. For each one, you can find out how many visitors viewed it, how long they spent there, and how often people added the product to their cart after viewing it. This means you see not only the numbers, but also which specific parts of your content visitors actually use.
How to evaluate the results correctly
Analytics compares visitor behavior before and after the description was added. However, this is not a controlled experiment, so changes in the results could also be affected by campaigns, discounts, seasonality, or other factors.
That is why we do not say, for example, that “the description increased sales by 42%,” but rather that “after the description was added, daily add-to-cart actions increased by 42%”.
If you want to truly verify the impact of a specific content variant, you can use the separate A/B testing feature in Pobo.

Thinking about Pobo? Let us show it to you.
Book a short 30-minute call where we'll show you how Pobo works, what it's good for, and how it can save you a lot of time and money.
Book a call


Book a call